Geographical Plotting with Basemap and Python p. 3
Here we cover even more of the many options to consider with basemap's mapping abilities. We still haven't even gotten to plotting yet! Don't worry, we will get there soon, I promise.
Here is some of the sample code from the video:
from mpl_toolkits.basemap import Basemap
import matplotlib.pyplot as plt
import numpy as np
def basicMap():
m = Basemap(projection='mill',llcrnrlat=-60,urcrnrlat=90,\
llcrnrlon=-180,urcrnrlon=180,resolution='c')
m.drawcoastlines()
m.drawcountries()
m.drawstates()
m.fillcontinents(color='#04BAE3',lake_color='#FFFFFF')
m.drawmapboundary(fill_color='#FFFFFF')
plt.title("Geo Plotting Tutorial")
plt.show()
basicMap()
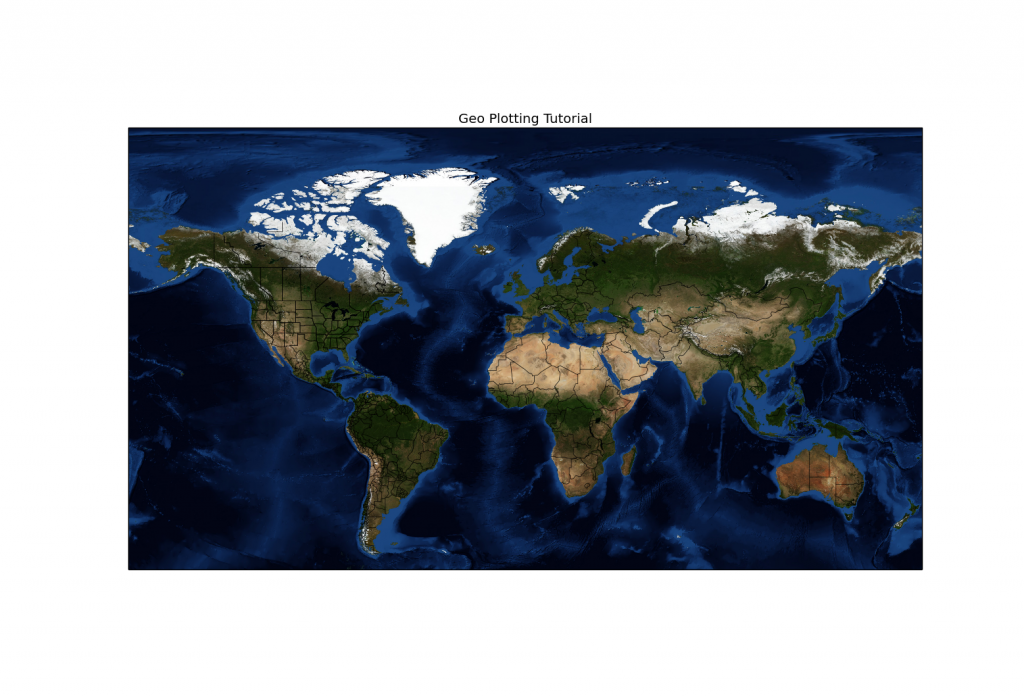
def coolerProjections():
m = Basemap(projection='mill',llcrnrlat=-60,urcrnrlat=90,\
llcrnrlon=-180,urcrnrlon=180,resolution='c')
m.drawcountries()
m.drawstates()
m.bluemarble()
plt.title("Geo Plotting Tutorial")
plt.show()
# are you getting an error like:
# ImportError: The _imaging C module is not installed
# This meanss you have PIL, but you have the wrong bit version.
# If it says you don't have PIL at all, then you better go grab it
# but this should have come with your matplotlib installation.
coolerProjections()
The first function will generate a map similar-ish to the previous one we did, but the last function will give us something much more interesting looking.
-
Matplotlib Crash Course
-
3D graphs in Matplotlib
-
3D Scatter Plot with Python and Matplotlib
-
More 3D scatter-plotting with custom colors
-
3D Barcharts
-
3D Plane wireframe Graph
-
Live Updating Graphs with Matplotlib Tutorial
-
Modify Data Granularity for Graphing Data
-
Geographical Plotting with Basemap and Python p. 1
-
Geographical Plotting with Basemap and Python p. 2
-
Geographical Plotting with Basemap and Python p. 3
-
Geographical Plotting with Basemap and Python p. 4
-
Geographical Plotting with Basemap and Python p. 5
-
Advanced Matplotlib Series (videos and ending source only)